Power BI Measures vs Calculated Columns – Why is it so hard?!
When first learning Power BI, it can be difficult to figure out when to create a new measure versus when to create a calculated column to get the custom value you need. I have no idea why this type of scenario is even built into a tool designed to put make the power of data accessible to a bigger pool of users with the idea of being easy to use. This is not one of those things, but I digress. So when do you use a measure versus a calculated column?!
In Power BI, use a measure if to summarize another field impacted by filters. Use a calculated field if you need each row of data to have an independent value not impacted by filters OR if the calculation is taking too long to calculate as a measure.
So that’s the high level explanation, but let’s dig into why I recommend this as the rule-of-thumb when you are working your data analysis magic in Power BI.
Defining Measures and Calculated Columns in Power BI
When working with Power BI, the end-user needs to be at the forefront of your mind. As we walk through what each piece is and when to use them, remember that the most efficient place to put a new field would be in the dataset itself.
However, when you are still in exploration mode without a clear plan as to what you need in the data or it just isn’t possible, then diving into measures and calculated columns will be a powerful tool in your arsenal!
What are Power BI measures?
Quick definition: a summary of another value
Real World Examples:
- Sales projections for next year based on sales this year
- Ratio of completed applications
- Year to date summary of sales
Essentially, you break out a measure when you want to aggregate another data element. A cool thing you likely overlook in Power BI is that it automatically calculates values like the totals. It creates a measure that you can’t purposefully manipulate like a field.
Creating measure allows you to manipulate it like a field as you need it. Check out these screenshots for a quick illustration of what I’m trying to describe.
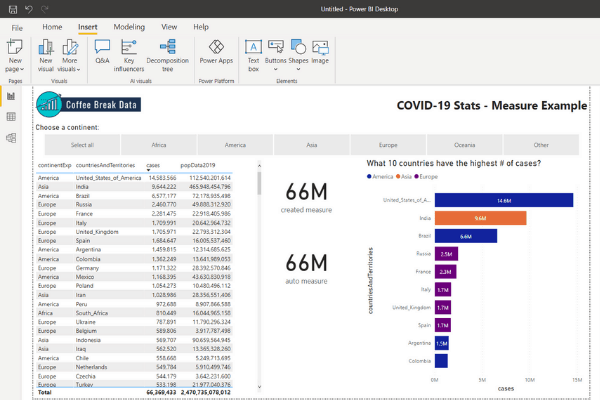
Cases just put on a PBI Card without anything else done to it is displayed as the auto measure.
The created measure is a measure created to ignore filtering.
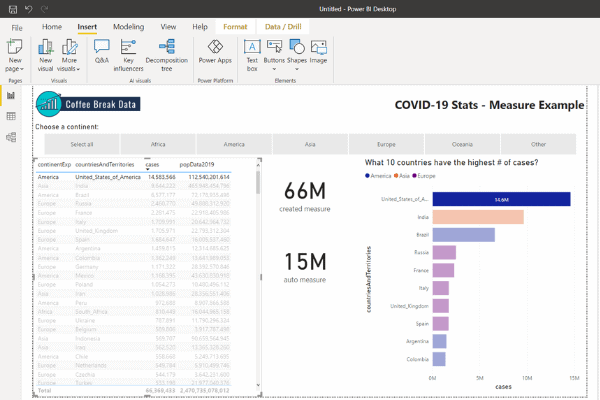
So in the example, cases is the base value that I’m summarizing how I want through using a measure – an automatic one courtesy of Power BI’s awesomeness & one I created.
What is a calculated column?
Quick definition: new column with row level detail
Real World Examples:
- High, medium, and low categorization of individual quality results of a data entry clerk
- Combining a first and last name of an insurance agent to display in 1 field as Agent Name.
Anytime you need each record in your data to receive a value, you will break out a calculated column. Measures can be built on a calculated column, but a measure doesn’t assign values well to each record.
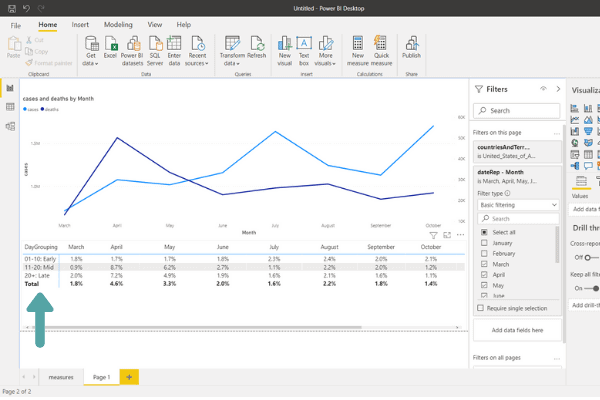
The % calculated is a measure that is able to be displayed by the calculated column created named DayGrouping.
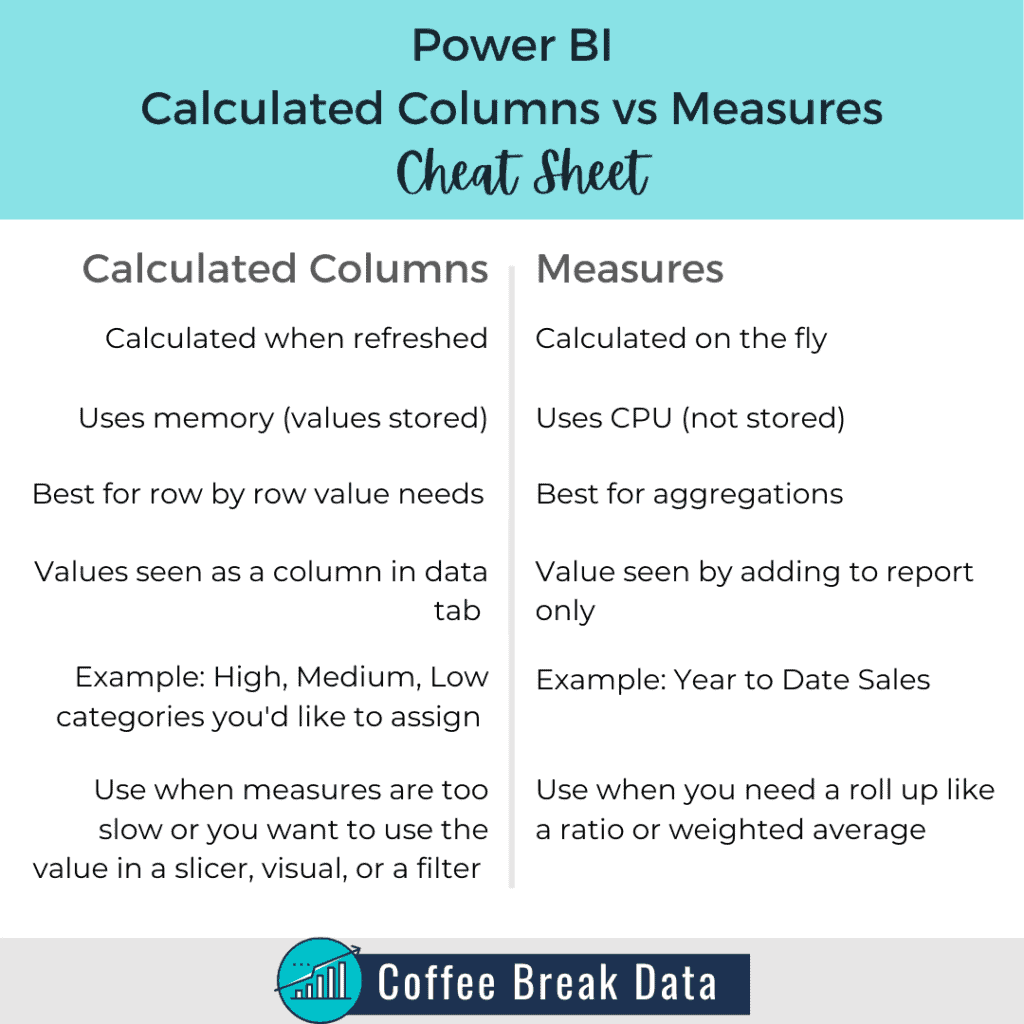
What is the difference between a calculated column and measure in Power BI?
There are many differences between calculated columns and measures in Power BI. Below is a cheat sheet to know when to break out either tool. Scroll below the cheat sheet if you need more details on those differences.
Short version:
- To improve the end-user experience, go calculated column
- To touch each row of data, go calculated column
- Rolling up anything, default to measure
When are calculated columns and measures calculated?
When are ‘measures’ calculated?
Measures are calculated on the fly by Power BI as the report is altered. You click on a graph, it calculates. You select a date range, it calculates.
It is using the active processing capabilities of the computer of the user.
The calculations happening as a user interacts with the report can be taxing to the performance depending on the number of records, how many calculations are in play, and the processing capacity of the user’s computer.
When are ‘calculated columns’ calculated?
Calculated columns are calculated when they are created and when the data source is refreshed. This means that it takes memory (aka RAM) to perform the calculation instead of the processor (aka CPU) of the end user.
This is why using a calculated column is a good way to improve the end user’s experience when interacting with reports.
Of course, the best option would be to have the calculation within the data source at all, but the calculated column is powerful enough to perform a calculation on each row of data without impacting the report user, at least!
How are measures and calculated columns stored?
Where information is stored will impact how you are able to interact with and build upon that information.
Where are measure values stored?
They aren’t! Measures are aggregations of detail record values, and the aggregated value measures are not stored or able to be viewed except for as a component of a report.
You can create measures that are a static value for viewing even when visualizations are altered, but the value itself is simply displayed – not stored.
Where are calculated column values stored?
Calculated column data becomes another part of the data model, so calculated columns are stored as another column. Literally.
You are able to view each data element within the Data tab.
Need more info?
Want a video walkthrough of a measure? Here is a YouTube video overview of Power BI measures. Leave me a comment if you have any questions about measures.
Want a video walk through of a calculated column? I have you covered here.
If the written run through about the differences between a calculated column and a measure is difficult to digest, I’ve got a comparison video for that.
Again, leave me a comment on a video if you have a question, or if you have another trick that could help someone with choosing the right tool for the job!