20 Benefits of Data Visualization
There are certainly more than twenty benefits of data visualization. There are also many reasons to look into those benefits. Data visualization has become increasingly popular and a necessary part of data analysis and the presentation of information from data.
The most common data visualization tools include charts or graphs, histograms, trees, scatterplots, tables, diagrams, infographics, dashboards, maps, matrix, network, the list goes on. These tools can be found on several available software that provides ease of performing your data visualization tasks, such as Python, R, Tableau, Domo, Power BI & many more.
If you are looking towards career opportunities in data or you are doing initial research, we can look at some high points of data visualization at a glance.
- 1. Our most dominant sense is visual
- 2. Effective communication
- 3. Good data visualization can inspire interest to investigate further
- 4. Data visualization is people-oriented
- 5. Data tells a story through visuals
- 6. Insight
- 7. Context
- 8. Speed
- 9. Versatility
- 10. Data visualization allows you to do more
- 11. Enhanced memory of historic events
- 12. Vie for and keep overstretched attention
- 13. Decision making
- 14. Quality of Decision made
- 15. Data visualization bridges gaps
- 16. Data visualization makes data more useable
- 17. Increased demand
- 18. Resources are increasingly available
- 19. Creates job opportunities & growth
- 20. Useful across an organization
1. Our most dominant sense is visual
I think this is a good way to start this list. Data visualization tells of its benefit in its name. From the beginning of known human history, we have investigated and recorded the world through the use of visuals.
Thus, human nature itself suggests that visualization is the most effective means of communicating with people.
Since vision is our most dominant sense, visualization of data is of course the simplest and most effective way of exploring data and communicating information from said data.
2. Effective communication
As mentioned earlier, vision is our most dominant sense; the use of well put together visualization could determine the success or failure of effective communication of information.
Data visualization helps to ensure that the intended message is passed across and gets the desired effect.
Many have found that what would otherwise have been a lengthy print report or spreadsheet of numbers can be better summarized and explained using data visualization.
Furthermore, the ability to communicate information using compelling and clear visuals can help inspire trust in your credibility, thus ensuring that greater attention is paid to your message.

3. Good data visualization can inspire interest to investigate further
When your data visualization is compelling enough, your audience may assume the accuracy of the rest of your message. In most instances, all of the information cannot be condensed into graphs, plots, or maps. There may be more information to look into in further detail.
Having highlighted the main points and gained the trust of your audience. You can inspire them to seek further information. Thus, the visualized data would provide a foundation upon which more information is built upon.
4. Data visualization is people-oriented
Without the use of data visualization, the result of data gathered and analyzed would be ordinarily be presented as-is. However, with data visualization, you determine the message beforehand. More effort is made to think of how best to ensure that the message is properly communicated.
You have to focus more on your audience when deciding on what data visualization methods and tools to use to present the information in a manner that will be most effectively received by your audience.
What are they trying to solve for? What problems have you identified?
You also think about how you want your audience to respond to the information presented.
Does the data lead to a solution or conclusion?
5. Data tells a story through visuals
Many times, there are layers upon layers of detail to go through in your presentation of information from data. Data visualization helps you direct the attention of your audience to the main points you want them to focus on.
When you really dive into good data visualizations, you’ll find that there’s a story in the data. That’s truly why a visualized conversation about what is going on in the underlying data is so much more effective. Storytelling.
6. Insight
If you present an excel sheet of numbers, the person looking at it may not at a glance be able to tell what those numbers are supposed to be saying. Data visualization helps to provide insight.
Let’s look at an example of a list of numbers showing numbers and degrees Fahrenheit represented along with colors ranging from bright red that reduces in brightness and fades into blue and then deep blue. At a glance, it would be understood that the data is supposed to be showing temperature variation over time.
Data visualization enhances comprehension with less effort from the audience!

7. Context
Good data visualization can be used to highlight the background or foreground or the environment within which the message you’re trying to pass on exists.
You can immediately SEE the increase or decrease, good or bad, growth or regression, comparisons, connections, variables, patterns, that would otherwise not be seen in isolation to provide context.
Good data visualization helps to ensure that the message you are trying to pass is what is understood.
8. Speed
Most times the people who have to make decisions based on data collected and analyzed do not have the time to run through several pages of numbers and text to articulate and understand the result of the research.
The fact that context can be gleaned at a glance from data along with differences, variations, patterns, connections, etc. helps to reduce the time within which information and highlights from data need to be communicated and received.
At a glance you can find what your focus needs to be on, and then you are directed to what detail you need to understand.
9. Versatility
While there are some guardrails naturally by how you show what kind of data, there is a lot of flexibility in how that message is conveyed. So many graph types, the ability to use color or even size of elements to aid what is important.
Then there is also the highly interactive tools that can be used to help the user dig-in in a self-service way.
Whoa! Don’t like that red number that indicates a hiccup for a certain team? Click on it. If designed well, the entire dashboard is should adjust like a filter so that only that teams results show to see what is driving that hiccup.
Or perhaps hovering over it gives you a trended chart to indicate overall improved performance month over month.
The options are seemingly endless.
10. Data visualization allows you to do more
Since far more complex data and widely varying information can be communicated, within less time, more reliance would be placed on data.
With the help of data visualization, information has become more accessible and useable and not just huge chunks of data gathering dust. It’s in the view of more people versus a select few who knew what questions to ask & had the resources to get it.
Therefore, more decisions in an increasing number of aspects of life can be based on data-driven analysis.
11. Enhanced memory of historic events
If we could retain more of the information we receive, we certainly can do more with that information. It becomes baked into your knowledge library, so the context and experience can drive your next steps down the road.
Context and insight that is gleaned at a glance are likely to be better retained. For example, we can recall that due to x and y factors there was a spike in the stock market in 2010 and due to an absence of such factors there was a significant dip in 2020.
The easily spotted connections and easily discerned insight along with the fact that humans have an inherent ability to retain pictures in long-term memory better than numbers and text makes data visualization a very important tool.
Having more information at your disposal due to increased ability for recall also affects the quality of decisions made
12. Vie for and keep overstretched attention
With the pace of our world today, there are very many things vying for the attention of the people who have to make decisions based on the information we intend to present.
When the information is presented using aesthetically pleasing and clear visuals, we have a greater chance to grab and hold attention long enough to ensure that the information gets passed to our intended target.
13. Decision making
When data is collected but hard to read, decisions would not be made from them as they should. Where, however, information is presented clearly, more of it is retained in the memory, and easily accessible and available, decisions can be made based on said data.
14. Quality of Decision made
We have far more information at our fingertips, or so it is assumed. Because of this, there is increased pressure on stakeholders to make better decisions.
However, poor choices can still be made with the mammoth size of information available due to information overload.
This makes it even more important than ever to make information simpler and more easily understood.
Also, data visualization helps update the information so that emerging patterns and changes over time can be more easily seen. All of these come together to affect the quality of decisions being made based on data.
15. Data visualization bridges gaps
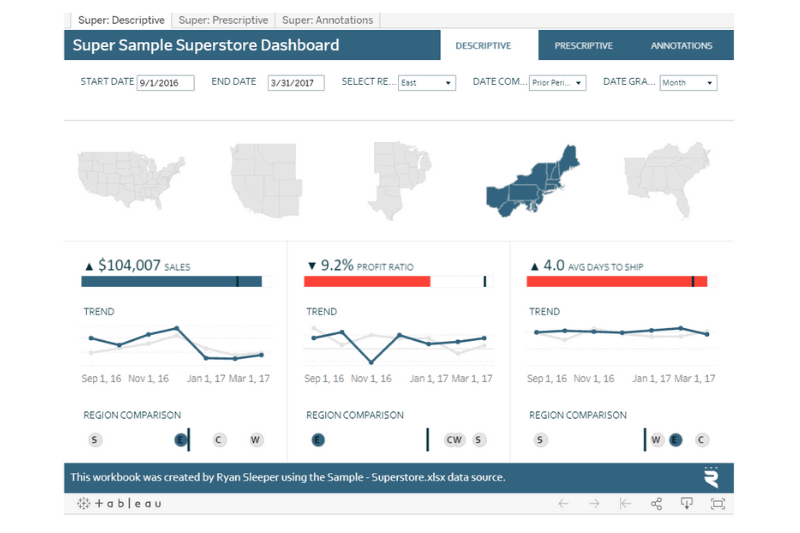
Data visualization helps to pass complex information to a mixed audience. When presenting information gleaned from data, the goal is identified from the outset.
The different classes of the audience are determined and a visual story is constructed in a manner that speaks to all concerned. Whether you come from an IT based lens or an operations one, being presented with visuals makes the message work for better for both backgrounds and concerns.
16. Data visualization makes data more useable
Data collected and presented in a manner that is easily understood ensures that the purpose for data collection is met.
Where the data is presented in a manner that many people who have to act based on said data may not be able to clearly understand the purport, it may appear that the data collection exercise and analysis was a wasted effort.
Data visualization provides a way to make data more useable.
17. Increased demand
Data visualization tools have been available and used for several centuries. However, there seems to be a new data visualization frenzy propelled by the availability of new technology.
A quick search on Google or YouTube would show an abundance of articles and lectures about data visualization. This makes it apparent that it has gained immense popularity.
Data visualization because of its increased popularity and demand has become a necessary skill to possess to stay relevant in this data-driven world.
18. Resources are increasingly available
We now have an increase in the number and variety of data visualization tools and software at our disposal. There are far more options available to more people of varying skill levels. There are software packages both free and paid that can be used by people with even little skill to put out creative data visualization. There are online communities and samples online to practice with.
Furthermore, unlike the time when print media was the means of information dissemination, the internet and social media have increased the demand and opportunities for the dissemination of information using visuals.
19. Creates job opportunities & growth
With data visualization literacy becoming as important as numerical and textual literacy, data visualization has become increasingly important creating more needs for and opportunities for analysts, designers, and presenters.
The key here is that this isn’t a conversation isolated to just data analysts. It can provide career growth opportunities to enhance existing employee positions.
Someone that has been in their role for a few years might love the opportunity to innovate & add data-driven activities to their role. With so many tools at our disposal for creating visualizations without being a programmer, it’s a natural fit for an employee with an interest in exploring what is possible.
20. Useful across an organization
Much focus has been so far on what data visualization does for the audience. Data visualization is also very useful for data analysts.
Data visualization is a very effective tool for data exploration. Rather than a more laborious effort expended in manually plowing through data sets, visualization can be utilized to see patterns, outliers, redundancies, and more that can affect conclusions from data analysis.
I use visuals daily to help craft the story of what’s going on in the business or identifying outliers. It’s a giant time saver for everyone in the organization.

