Is Tableau Hard to Learn?
Data visualization is a hot topic. So many tools have been created and existing tools have been modified to provide better looking visuals than what was available.
If you’ve seen a Microsoft Excel spreadsheet from 2010, even it looks remarkably different today. While tools such as Excel have made great strides, interactivity is what makes the data visualization space so exciting. Gone are the days of 10 reports to answer 1 question with the ability to let a user drill down. Tableau is one of those tools that shines in this space. So you’re looking to understand how hard Tableau is to learn?
Learning Tableau requires that you dedicate time consistently and apply your knowledge in real-world settings to master it. Having an understanding of business intelligence or some reporting experience will reduce the learning curve.
Let’s walk through what Tableau is for some background, skills that will enable you to learn Tableau faster, and resources to help you learn the tool and start creating visualizations that will move your department or business forward!
What is Tableau?
Tableau is data visualization software. It is a tool that allows users to connect to practically any data storage location from many different datasets and merges the information into a report. Cloud, on-premise databases, or even spreadsheets can be joined up to provide a cohesive report.
Tableau primarily focuses on business intelligence (historical data for reporting), but there are some predictive analytics (future projections) incorporated. In addition, Tableau can connect to tools that can do more heavy statistics – like SAS or R.
They are constantly expanding, and there is some functionality that allows you to type a question and will produce an answer. I didn’t say build a report. I said ‘type a question’. Think like what you can do with your smart home speakers, “Alexa, how long is my commute?” Those smart home responses are quirky, and sometimes Tableau can be, too, but they are making big strides in this space.
Now the cool part is that any report (or dashboard) you create can be published and shared through a browser and even mobile apps. How cool is it that your team can access crucial information on the go?!
One of the key things that made Tableau a go-to for data viz tools is that it has a point-and-click interface that lets you put together graphs by dragging items and dropping onto a blank canvas. You’re making art with data, and there is a very involved tribe for inspiration or help (take note of this if you’re looking to learn Tableau).
In these reports and dashboards, you can build in some slick interactions, and users can click on individual data elements and dive into the details or filter through that same point-and-click process. If you see a table, chart, or anything on a published Tableau dashboard, I urge you to click around. Heck. Try to break it. You may uncover issues in the data, but you won’t break it. As a matter of fact, I can go to that same report, and I won’t see anything you did. My report will be fresh as if it were just published.
There are a ton of features like email alerts and security features. What does all of this mean to someone wanting to learn Tableau?
Well, the drag and drop, visual interaction with report building does make getting started in Tableau a more pleasant experience than other tools, but all of those features means there is a lot to learn!
What are the Different Versions of Tableau?
Tableau has expanded into a variety of products. When I started working with Tableau mere years ago, it was Tableau Public, Tableau Desktop, and the functions to support those. They’ve since expanded to incorporate cloud options and data preparation options. Here’s a full list with a snippet of what that product serves, and here is a link to Tableau’s latest product line up.
- Tableau Desktop: The flagship to exploring and interacting with data. You create and play in this.
- Tableau Prep: Data prep is the most time-consuming activity in the data space, and this is a tool designed to make that simpler.
- Tableau Server/Online: The spot where you access reports, and if your organization doesn’t want to house the info on in-house server, you have this as an option for storage.
- Tableau Mobile: The version that gets you the mobile views on both iOS and Android devices.
- Tableau CRM: The part that interacts with Salesforce that used to be called Einstein Analytics
- Tableau Public: The playground if you don’t have a license! It’s cloud-based and free. The downfall here is that anything you produce here is public – including the underlying data in your visualizations. It’s a great sandbox to play and learn, and browsing can be quite inspirational in the community!
Also know that Tableau has different ‘roles’ that it calls users. This is a licensing term, but it also relates to how you’ll train. Make note of where you fit for when we dive into the training resources.
- Creator: The report creator. Interchange report for dashboard and creator for developer.
- Explorer: The person that will interact with Tableau Server or Online that CAN MODIFY & CREATE
- Viewer: The person that will ONLY interact with the reports published FOR THEM. Interaction but not creation.
- Admin: The person that holds the keys to the Tableau kingdom that cares about security and deployment of the tool.
What Existing Skill Sets Will Help You Learn Tableau Fast?
Tableau is such a great tool to learn if you are new to data, but the learning curve to learn Tableau is faster if you already are involved in either data structure or reporting.
Just knowing how to structure data and how to create charts has you ahead of the curve in that regard. You know what your organization has, and then Tableau makes it easy to up your game!
Don’t let this stop you if you are unfamiliar with metrics, reports, data warehouses, programming languages – whatever. It helps, but it isn’t critical.
There are great learning resources available to help you start creating interactive dashboards for your organization.
Plus I find the best way to learn is to get your hands dirty. Tableau makes that part easy. You may not be able to write a calculation to make your own KPI, but the drag and drop feature will have you well on your way into a bar chart or line graph pretty easily.
Don’t let this stop you if you are unfamiliar with metrics, reports, data warehouses – whatever. It helps, but it isn’t critical. There are great trainings available. Plus I find the best way to learn is to get your hands dirty. Tableau makes that part easy. You may not be able to write a calculation to make your own KPI, but you’ll be able to drag and drop your way into a bar chart or line graph pretty easily.
What is the Hardest Part to Learning Tableau?
Understanding how data works is difficult. However, if you have reporting experience, you’ll likely to find that data preparation is the hardest part to learning Tableau.
But to be fair, data prep is the hardest part to just about all data tools.
If you do not have experience with relational databases or making reports, that’s the first hurdle. An example is that records need to have unique identifiers (think like your social security number only belongs to you). Then you also have to have field that allows you to connect to other data sources. Understanding this is key, or you’ll find yourself back and forth from exploring to prep to exploring to prep.
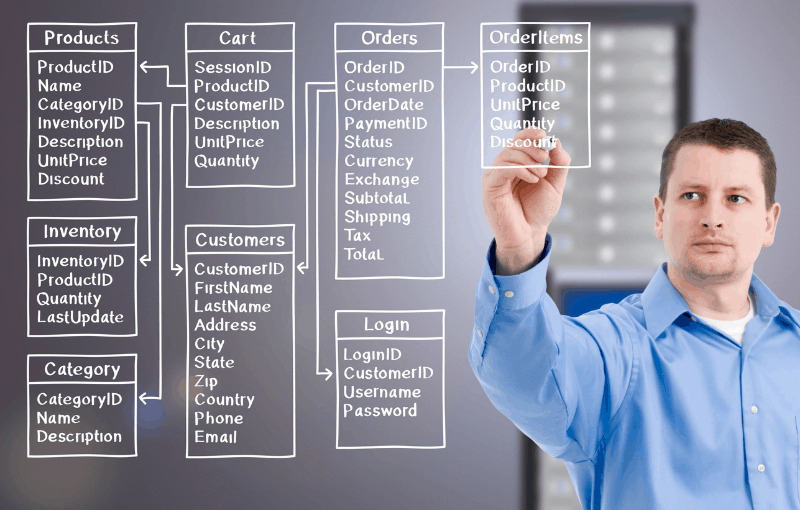
Along the same lines is that anyone that works with data will tell you that most of your time spent building reports or churning out models is spent in that data preparation space. Tableau has done some neat things to simplify this through their prep tool, but dirty data is dirty data.
It can be complicated to clean things up and prepare the data to make ACCURATE reports that make sense. Isn’t that the kicker? A report that is right and makes sense?!
Just know that Tableau IS NOT EXCEL! It is truly meant to inspire interactive dashboards that let users immerse into their data and be able to manipulate it well enough to start to answer their own questions, easily & intuitively.
One of the hardest things to do in Tableau is to make a good-looking table.
— Spencer Baucke (@JSBaucke) January 6, 2022
Resources to Learn Tableau
Tableau can be an expensive tool for a business, but training does not have to be. The cool thing is that Tableau offers FREE training online. No catch. Here is a link to Tableau’s free training, and it is broken down into the roles listed above.
You simply pick your category (Creator, Explorer, Viewer, or Admin), and start watching bite-sized tutorials to get you up to speed with Tableau.
Is Tableau’s free training any good? Yes! I used Tableau Desktop for 3 months, and I took the base certification after just that free training to brush up on the Tableau jargon to accomplish things. I passed with flying colors. The training is solid.
The key is to use the tool. If you take the training sporadically and don’t apply the concepts to real-world scenarios, it is just like any other class or training you’ve taken – you’ll struggle.
What’s that saying?
If you don’t use it, you lose it.
If you want to learn Tableau at a faster pace, it’s going to come from repetitively using it in meaningful ways to you. Getting your hands on your organizational data and mimicking a dashboard you find an image of online is an excellent starting point.
You can always do this with an open data source like data.gov to experiment with on Tableau Public if you do not have access to Tableau Desktop or organizational data.
The Tableau Community is one of the best resources, and I have yet to run across a tool with as much information to help you Google your way through a problem than THIS visualization tool. You’ll find a Tableau hosted forum here and an active Twitter community, as well, if that is your speed.
From simple charts to how to use advanced features or combining data sources, you truly have access to Tableau experts to help you build more complex visualizations.
Should You Get a Tableau Certification?
Certifications have mixed reviews, so I am asked often if I recommend someone earn a Tableau certification. This particularly comes into question because portfolios are all the rage, particularly for someone without an extensive work history.
That said, I’ve been working in Tableau for years, and I don’t have an online Tableau portfolio.
After hours, I have a life and family. I’ll study for a certification after hours, but that has an end in sight. Let’s layer in that I take protecting the data I work with seriously, so I’m not even comfortable trying to create a portfolio based on masked data. It’s just professional & avoids messing up and sharing what shouldn’t be shared.
I also have first-hand experience in being first in line for a lucrative job courtesy of the certification I earned, but n = 1. n=1 means the number of records in the dataset is 1 (which basicallyl means YMMV (your mileage may vary)).
For career mobility, I recommend that you earn a Tableau certification if you have a limited opportunity to build a public portfolio but still want to show you know the tool.
If you hate tests (or they hate you), just build the portfolio. If your career path does not have you moving around or up in the analytics space, you can skip the certification.





One Comment