3 Quick & Easy Ways to Use Google Analytics to Improve Content
Do you want to improve your content without sinking a lot of time into it? Data can help you do this courtesy of Google Analytics.
There is no time like the present to get started, but sometimes not knowing where to start can hold you back from even getting started.
Consider me your fairy godmother of Google Analytics.
With the 3 actionable data-driven strategies in this post, you’ll be on your way to using Google Analytics for actionable steps to optimize your content today!
Spoiler: You may find bonus content to help you on your journey. Here’s the first one:
Download my free guide – Data-Driven Tactics to Boost Post Traffic now
Prep Step
Do you ever site down at your desk, ready to start publishing, only to realize that you need to stop whatever you’re doing because you forgot to take a few photos to finish up?
I feel all of that, but you need to have Google Analytics installed already. Otherwise, you’re just not going to have the history you need to walk through this.
Loves Data has a great video to install here if you’re up for DIY. If you find you need a hands-on session to get set-up, I can help you with that.
Already installed? Then let’s carry on! If you don’t, come back by when you have some data to explore in Google Analytics.
Quick-Win #1: Analyze Audience Behavior for Success
One of my favorite strategies when I first start looking at a new-to-me site’s analytics is looking at what the visitors think of the site, and I find it helps me get on top of how a site is performing beyond the traffic conversation. And traffic is not part of this step. 🙂
The first layer to this is looking at the bounce rate and time on page/session duration/average engagement time. If your visitors hang out for a good chunk of time, that’s fantastic!
If they are skimming, getting their answer & bouncing quickly, there’s an opportunity.
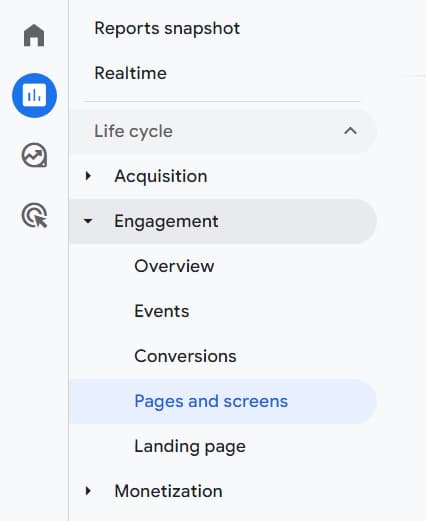
In Google Analytics 4, Engagement > Pages and screens > and then scroll to the bottom. You’ll need to customize the report for bounce rate, but ‘Average engagement time’ is a great focus point.
As I start analyzing, I like to hone in on these 2 metrics trended over time. This becomes a baseline that helps me identify bright spots within the specific pages in the content analysis.
Another metric that helps me get the lay-of-the-land are traffic sources. By understanding where the traffic comes from, I can immediately see your strategy (unintentional or not). And if I’m wrong, then something really cool is working for you that you should lean into!
Using Google Analytics to improve content is really this simple. If you’re thinking numbers are the bane of your existence, that’s what this exercise really is. Google does the heavy-duty data work for you!
If your blog is a key component of your business, then blog KPIs (Key Performance Indicators) that you set and track over time are critical for success. You can find a more in-depth look at this blog post here.
Quick-Win #2: Understanding Content Performance
Sometimes the best thing you can do for your blog is to focus on how specific pages on your site are doing.
Now we can start talking about traffic. You might have a sense of your traffic already, but diving into how specific pages are performing is where the magic happens here.
Best & Worst Performing
This starts by looking at the top performing content. You can decide if that is the top 10 or top 10%, but which articles are bringing in the most traffic? Remember when I mentioned taking a bounce rate & time on page baseline?
Layer in the bounce rate and time on page for these pages, and you’re looking at bright spots or opportunities on your highest traffic pages.
I’m also scanning for % Exits to know which pages aren’t keeping your visitors on your site now that we’re looking at page-level interaction.
Now let’s think of the inverse & sort for the lowest volume, & therefore least impact to your bottom line.
What are your lowest performing pages and posts? This becomes an automatic list of action items to improve.
Your top and bottom performers with the ability to layer in average engagement easily is available in the same area Engagement > Pages and screens > scroll to the bottom.
Just use the arrows next to the Views metric to sort highest to lowest & then lowest to highest when you’re ready.
User Flow
To round out how Google Analytics will help you improve your content performance, I like to look at the user flow. For those top pages, what page are they navigating to next? Is it the best for your visitor’s needs AND your business?
I do not look at user flow necessarily for the bottom posts because it’s likely a better use of time to improve that content & as part of that, you’ll consider the next best spot to send a visitor as part of the content upgrade.
Of course, there are a lot of pages in between your absolute best and worst performing pages, which is why I built the Page Performance Tracker. It’s a Google Sheets document that connects directly to your Universal Analytics & lets you see visually which pages are doing great or might need some love.

Quick-Win #3: Using Google Analytics to Optimize Content
Grab a cup of coffee because now we’re getting ready to talk about actions you can take to use Google Analytics to improve content.
If that sounds good, let’s get started:
- Use keywords that Google see you for
- Improve Click Through Rate
- Make sure site speed is up to par
- Device performance – Don’t forget about mobile users!
- Test & iterate with each change you make
Use the keywords search engines already see your blog as relevant for
Google Search Console is my favorite here as Google retires Universal Analytics. You can see keyword information inside of Google Analytics there, but take a look at your high traffic pages in Google Search Console.
The Query terms are the verbatim things that people are typing in & Google offers a page on your site up to them (even if you’re like #86 in what is offered up).
If the topic is something in the page offered up, is it explicitly offered in a useful way? Could you add a relevant paragraph or infographic to up the value for a visitor?
If you start seeing semi-related-but-not-quite, that’s an opportunity to add a fresh article to your content plan.
Improve Click-Through-Rate
In the same vein, if your click-through-rate is low from the search engine traffic for the keyword(s) you’re aiming for, is your title click-worthy enough? Or is it different enough from the other SEO optimized top pages to entice the click? It’s easy to see this in Google Search Console.
Site Speed Check
Have you been to a site that takes so long to load, that you just back out & go to the next in the list your search of choice offered up? Yup. Me, too.
I know that display ads slow up a site, but if that’s a primary source for your blog, I still urge you to keep tabs on this. Your ad partner is using imperfect algorithms that could be changing the experience.
I quite literally had Vignette Ads turned off on my niche sites through my ad partner, and wouldn’t you know, they were ALL magically turned back on. I know that’s not site speed, but it IS an example of things changing without knowing that impacted something important to me – customer experience.
Don’t Forget About Device Performance
When you’re running a business, getting caught up in just looking at the traffic & moving on can be easy. Don’t forget to take a look at device performance if you want to use Google Analytics to improve your content.
If you’re in the Business to Business (B2B) space then chances are the percentage of desktop traffic is high, but this has started to shift over the years.
Just don’t make that assumption without KNOWING. What devices are your visitors coming from?
Regardless, you’ll want to be sure your site and individual pages are ready for your visitors on mobile. How many times have you been out for a walk when an idea pops in your head that sends you down a brand rabbit hole?
I will sometimes put a note in my phone to revisit when I’m back at my desk, but sometimes I’m googling on the fly in my browser right then and there. Just this morning, I saw a heading of a page builder clearly not optimized for mobile. I found myself scrolling, scrolling, scrolling to get passed a phrase where each letter was on its own line.
Test! Test! And Test Again!
I keep a log of changes I make & why. I have track things I do like tech changes (plug-ins or host moves) and even track content upgrades. It’s a mini-database in a spreadsheet of what’s going on, so when I look back in 3 months, I know if my efforts were effective (or not).
My most recent experiment I got some insight into was turning display ads OFF on my highest traffic post of a niche site. I wanted to see if by turning them off, did it improve my subscriber conversions on that article.
I turned off the ads, made a calendar entry for 3 months later, and noted it in my change log.
It did improve the conversion, so now I have the data for some ROI math to see if the ads or the email marketing potential is best for that site.
I would have forgotten if I hadn’t set the calendar entry, so don’t forget that part of this process!!
TLDR
I hope this post has given you a roadmap for some big wins this month to use Google Analytics to improve content. From understanding the flow your audience takes to making sure the highest traffic pages are optimized for mobile, any one of these actions helps you run a data-driven blog.
What’s your favorite idea from the above? Drop me a comment below!
Remember, if you want to work with me to understand your data, you can always contact me here.