Average of Averages is Wrong. Here’s Why.
I remember the first time that I was called out for doing this exact thing. Averaging an average in a spreadsheet. Now the crazy thing is that I had been doing it for months and maybe even years in a business intelligence role.
Before you get all judgy this was many, MANY years ago.
Anyhow, it definitely took me by surprise, and I was very embarrassed when I was called out. But as it turns out, the business leader that was using my reports for their presentation was even more embarrassed. So what’s the big deal? Let’s dive into why average of averages is wrong?
An average of averages is wrong because it does not take the units that make up the underlying values into consideration. Each value being averaged is weighted equally.
Let’s say that you want to average 2 averaged values. One value in the average has 2 units and the second value has 1,000 units. The 2nd value with 1,000 units would definitely skew the end result differently.
This is an scenario where a visual walk-through is more helpful to understand why an average of averages is inaccurate. Check out this video on why averaging an average is bad math on YouTube for an illustration of how this works.

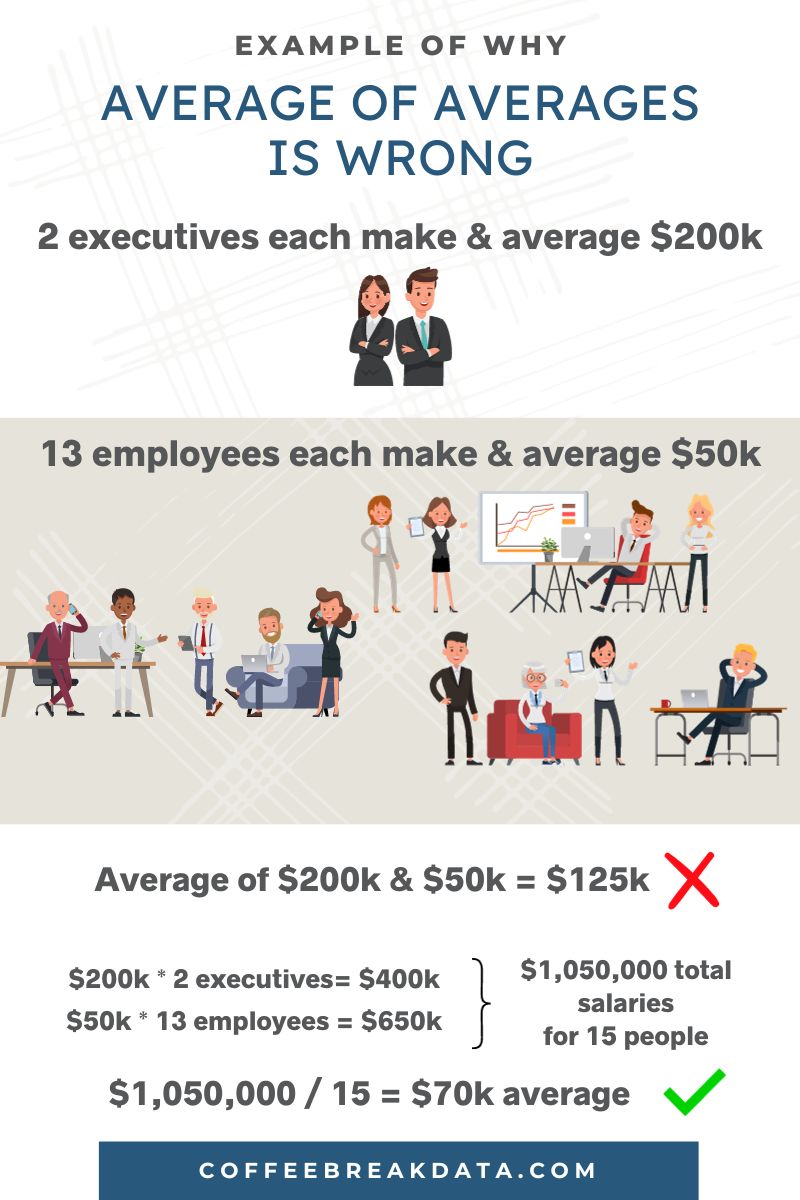
Here’s a visual to show why an average of averages is not the same as a true average.
What to do Instead
So, we’ve established that an average of averages is a no-go. But what’s the alternative? How do we approach situations where we need to consolidate multiple averages in a way that’s accurate and doesn’t lead to those embarrassing call-outs?
Understanding Weighted Averages
The answer lies in weighted averages. A weighted average, unlike a simple average, takes into account the different ‘weights’ or importance of each group of numbers.
Let’s revisit the previous example. You have two sets of values to average. One group has 2 units and the other 1,000 units. Instead of treating them equally, a weighted average gives more importance to the group with more units. This approach reflects the real-world impact of those larger groups on the overall average.
Step-by-Step Guide to Calculating Weighted Averages
- Identify the Sets: Break down your data into the distinct groups you’re averaging.
- Sum of Units: Calculate the total number of units across all groups.
- Individual Weights: For each group, divide the number of units in the group by the total number of units.
- Apply the Weights: Multiply each group’s average by its respective weight.
- Sum It Up: Add these weighted averages together, and voila! You have a weighted average that’s far more accurate than an average of averages.
Why Weighted Averages Matter
Weighted averages aren’t just about accuracy. They reflect the real significance of each group in your data. This approach can provide insights that are lost with simpler methods, especially in complex business environments where every figure contributes to the bigger picture.
Real-World Application
Imagine you’re evaluating the performance of different departments in a company. One department has 50 employees, another just 5. A simple average of their performances doesn’t reflect the larger department’s impact on the company’s overall performance. A weighted average, on the other hand, gives you a clearer, more representative picture.
Final Thoughts
Shifting from the average of averages to weighted averages might require a bit of a mindset change and some extra steps in your calculations. But the accuracy and relevance of the insights you gain are well worth the effort. It’s about doing justice to the data and the story it tells.
And remember, it’s not just about avoiding embarrassment in business meetings. It’s about making informed, data-driven decisions that reflect the true dynamics of your business.
Happy Analyzing!